Serial Station Data (Water samplers, STD, CTD, BT)
Statistical graph display
You can click to enlarge the picture.
Time series of Data Count (data Type)
各層観測の数量をデータ項目別に時系列(1772年~2010年)でグラフ化したものです。

Time series of Data Count (Instruments Type)
各層観測に使用した機器の割合を時系列(1772年~2010年)でグラフ化したものです。

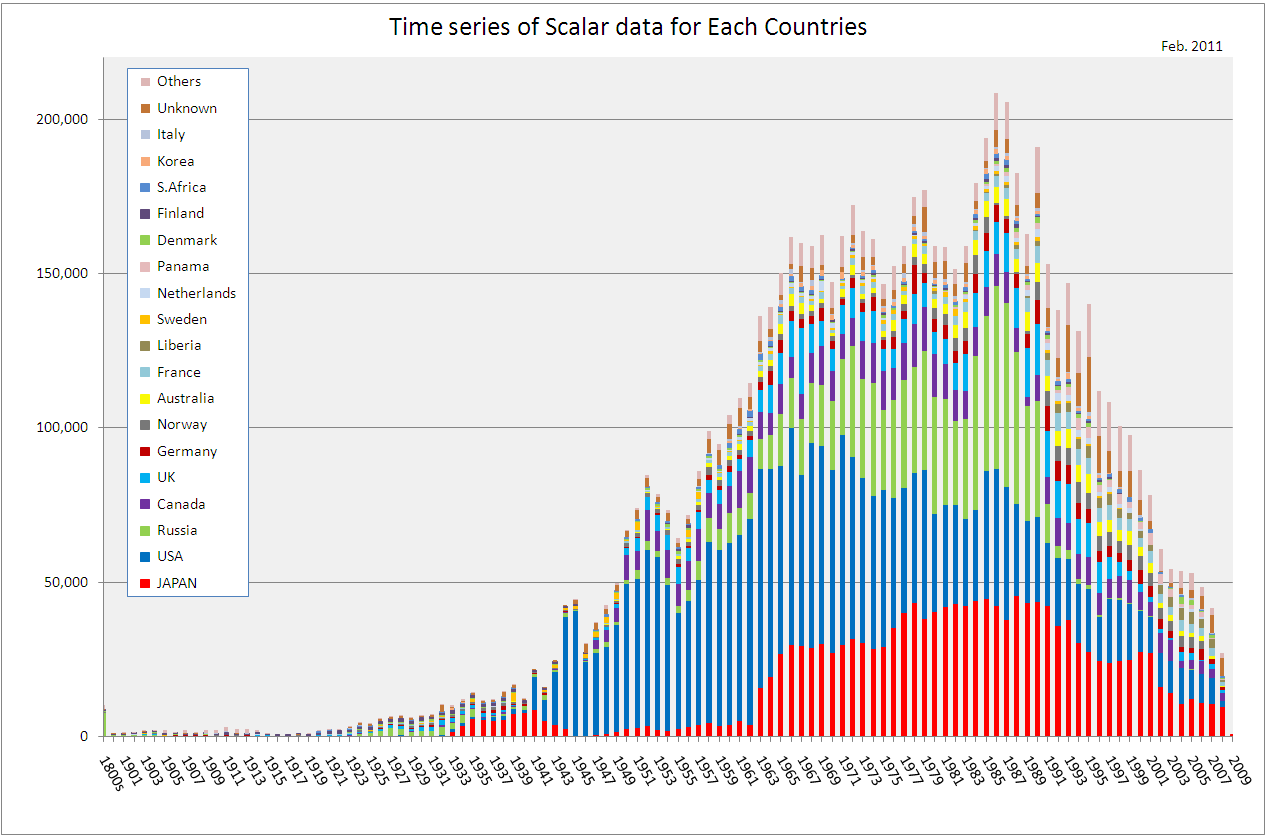
Time series of Data Count (Country)
各層観測の割合を取得国別に時系列(1772年~2010年)でグラフ化したものです。
Data Source
- Data Source
- Domestic Marine Agencies,?Universities and NODC
- Geographic Area
- Worldwide oceans
- Time Period
- 1772 - 2010
- Data Volume
- 13,048,276 stations
- Retrieval Key
- Country Code, Institution Code, Observed Date, Ship Code, Observed Area(Lat., Lon.), Project Code, Observation Item