| Data Acquisition Efficiency How to Calculate ? |
||
| Number of days in 1 year = 365 | ||
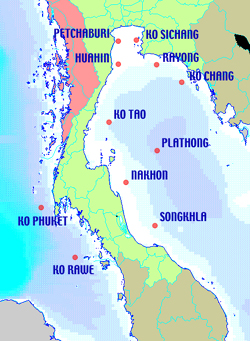
| A Number of days buoy/sensor is in position and working. |
B Number of days buoy is drifting or not working. |
C Number of days buoy is not deployed. |
| % Buoy Working in Position | = | [ A / ( A + B ) ] * 100 |
| % Buoy in Position | = | [ ( A + B ) / 365 ] * 100 |
| % Data in 1 Year | = | [ A / 365 ] * 100 |
| % Buoy Working in Position | |
| 1 9 9 2 - 1 9 9 9 | |
| Position | % |
| Sichang Island | 85.9 |
| Rayong | 89.3 |
| Chang Island | 82.0 |
| Platong | 100.0 |
| Tao Island | 75.2 |
| Songkhla | 71.8 |
| Petchburi | 96.9 |
| Nakornsritammaraj | 48.3 |
| Rawi Island | 55.0 |
| Phuket Island | 85.8 |
| Average | 84.0 |
| % Sensor Efficiency | ||
| Parameter | % Sensor Working [ A / ( A + B ) ] * 100 |
% Data in 1 Year [ A / 365 ] * 100 |
| Wind Speed | 64.5 | 44.8 |
| Wind Direction | 72.9 | 50.6 |
| Air Temperature | 73.5 | 51.0 |
| Air Pressure | 76.3 | 52.9 |
| Wave | 78.6 | 54.0 |
| Current | 66.8 | 46.3 |
| Light Attenuation | 40.4 | 27.0 |
| Dissolved Oxygen | 54.6 | 36.5 |
| Water Temp 3.5 m. | 74.4 | 46.7 |
| Water Temp 5 m. | 58.8 | 17.9 |
| Water Temp 10 m. | 54.6 | 16.6 |
| Water Temp 15 m. | 32.9 | 1.8 |
| Water Temp 20 m. | 56.4 | 13.9 |
| Salinity 5 m. | 43.9 | 13.3 |
| Salinity 10 m. | 44.6 | 13.6 |
| Salinity 15 m. | 22.5 | 1.2 |
| Salinity 20 m. | 42.1 | 10.4 |
| Buoy Deployment/Maintenance | ||||||||||
| Position | 1991-1992 | 1993 | 1994 | 1995 | 1996 | 1997 | 1998 | 1999 | 2000 | Total |
| Sichang Island | 7 | 7 | 4 | 1 | 4 | 5 | 3 | 4 | 1 | 36 |
| Rayong | 6 | 5 | 4 | 0 | 4 | 4 | 3 | 5 | 2 | 33 |
| Chang Island | 3 | 6 | 5 | 1 | 1 | 4 | 3 | 3 | 3 | 29 |
| Platong | 1 | 4 | 3 | 1 | - | - | - | - | - | 9 |
| Tao Island | - | 5 | 4 | 1 | - | 2 | 1 | 3 | 0 | 16 |
| Songkhla | - | 3 | 4 | 1 | - | 2 | 1 | 2 | - | 13 |
| Huahin | - | 5 | 5 | 1 | 4 | 4 | 3 | 3 | 3 | 28 |
| Petchaburi | - | - | - | - | 3 | 4 | 3 | 2 | 2 | 14 |
| Nakorn | - | - | - | - | - | 2 | 1 | - | - | 3 |
| Rawi Island | - | - | - | - | 2 | 4 | 0 | 1 | 2 | 9 |
| Phuket Island | - | - | - | - | 1 | 4 | 0 | 2 | 2 | 9 |
| Total | 17 | 35 | 29 | 6 | 19 | 35 | 18 | 25 | 15 | 199 |
| Note : | - 0 |
no deployment plan no buoy deployed |
||||||||